
TITLE : Economic Trends
페이지 정보
본문
■ ECONOMIC TRENDS
Here’s a look at Korea’s major economic indicators that provide an overview of the country’s recent economic developments.
▶ SUMMARY AND ASSESSMENT
■ The Korean economy remains lackluster, witnessing a considerable decline in exports

● The downturn in domestic demand has been somewhat alleviated, driven by the service industry, while financial markets demonstrate relative stability.
- With the resurgence of travel demand, service production-particularly in face-to-face businesses has observed a more accelerated growth
- The sluggishness in retail sales moderated, led by automobiles, and construction investment posted a faster growth, led by the building construction sector
- Despite overseas bank failures, the financial market maintains stability, while the service industry exhibits promising indications of progress.
● Nonetheless, manufacturing-led economic stagnation lingers as exports contract due to the global slowdown
- Exports remain sluggish, particularly in the semiconductor industry
- Consequently, the manufacturing industry faces elevated inventory levels and reduced capacity utilization rates, with production experiencing a marked decline.
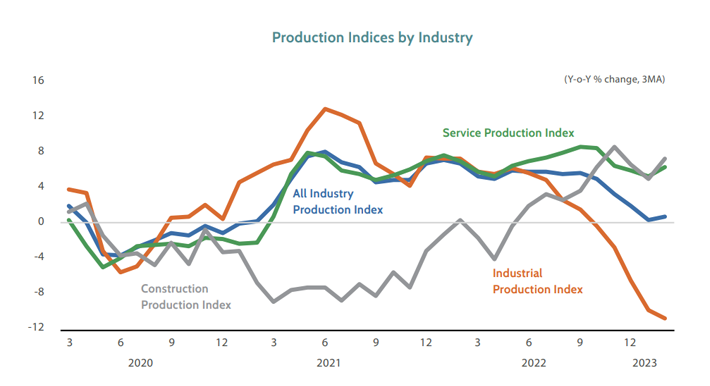
■ Economic Activity: The service industry sustained robust growth, but the economic deceleration persists as the manufacturing industry contracted
● In February, all-industry production expanded by 2.9%, surpassing the previous month’s figure (-1.3%), primarily attributed to an increase in workdays (-0.5 day → +2 days).
- Industrial production (-13.0% → -8.1%) continued to decline sharply, although there were substantial gains in automobiles (10.7% → 26.2%) and machinery equipment (-8.4% → 8.6%). These gains were offset by declines in semiconductors (-33.9% → -41.8%) and electronic parts (-32.8% → -36.3%). On a SA MoM basis, industrial production declined by 3.2%.
- Service production (4.8% → 7.2%) increased by a significant margin, primarily driven by accommodation and food services (8.1% → 22.5%), transport and warehousing (11.2% → 20.6%), and arts, sports, and recreation-re lated activities (11.0% → 32.1%). This growth was due to a rise in travel demand, including an influx of foreign tourists.
- Construction production (3.7% → 22.4%) expanded, partially reflecting the base effect, but the housing market continues to be lackluster, suggesting that the recovery of construction activity has not yet materialized.
● The manufacturing industry remains subdued, displaying a reduced average capacity utilization rate (70.8% → 68.4%) and a heightened inventory-to-shipment ratio (120.8% → 120.1%) due to the struggling semiconductor market.
- Exports remain sluggish, particularly in the semiconductor industry
- Consequently, the manufacturing industry faces elevated inventory levels and reduced capacity utilization rates, with production experiencing a marked decline.
● The service industry exhibits signs of recovery, driven by the uptick in travel demand, while the manufacturing industry remains sluggish, with declining exports-particularly to China-stemming from the global economic slowdown
- The non-manufacturing BSI on future tendency is improving, approaching its long-term average level (77).
* Non-manufacturing BSI on future tendency (SA): (Jan. ’23) 76 → (Feb.) 72 → (Mar.) 74 → (Apr.) 75
- As a result of the global economic slowdown, the decline in average daily exports is deepening, particularly to China. Additionally, the manufacturing BSI on future tendency remains at a low level.
* Average daily exports (%): (Jan. ’23) -14.4 → (Feb.) -15.9 → (Ma r.) -17.2
* Average daily exports to China (%): (Jan. ’23) -29.5 → (Feb.) -31.1 → (Mar.) -36.2
* Manufacturing BSI on future tendency (SA): (Jan. ’23) 71 → (Feb.) 66 → (Mar.) 65 → (Apr.) 67
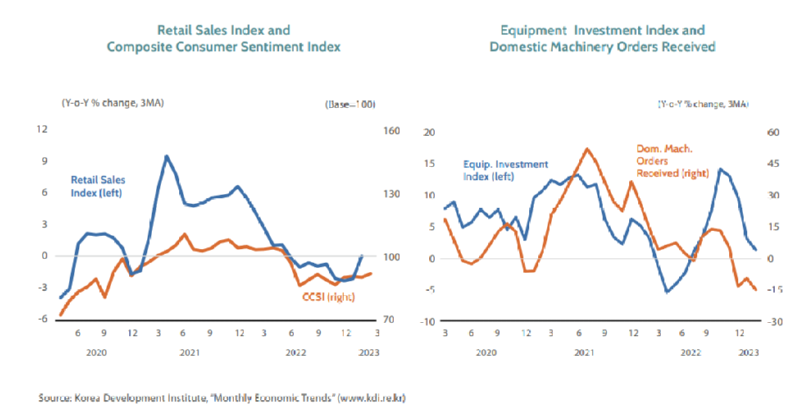
■ Consumption: Automobile retail sales witnessed a remarkable upswing, and service production sharply increased due to a surge in foreign tourists, indicating that the stagnation in consumption is beginning to ease.
● In February, retail sales shrank by 0.8%, reflecting the previous month’s trend (-0.9%): The escalation in durable and semi-durable goods sales was counterbalanced by a more pronounced drop in non-durable goods sales.
● Service production (4.8% → 7.2%) exceeded the previous month’s growth as face-to-face activities resumed following the relaxation of preventive measures.
● March’s CCSI was registered at 92.0, up from 90.2 in the previous month
■ Equipment Investment: Equipment investment remains subdued as the manufacturing industry weakens.
● In February, equipment investment (5.7%) grew faster than the previous month (-4.9%), attributed to increased workdays (-0.5 day → +2 days).
● The persistently low average capacity utilization rate for manufacturing indicates limited demand for equipment investment.
● Construction Investment: Construction investment saw strong growth, driven by the building construction sector, signifying a moderation in stagnation.
● In February, the value of completed construction (constant) rose 22.4%, surpassing the previous month’s figure (3.7%), partially due to the base effect.
● Construction investment displays signs of recovery, including a decelerated increase in construction costs and improved sentiment indicators related to construction.
● The construction orders received (-7.4%) declined, led by the civil engineering sector, and various factors continue to impede the recovery of construction investment, such as the persisting sluggishness in the real estate market
▶ SEMICONDUCTOR INDUSTRY TRENDS
■ The semiconductor industry has played a significant role in the ongoing economic deceleration, as the situation has deteriorated to levels approaching the lows observed during previous crises.
● In February, multiple semiconductor-related indicators deteriorated to an extent reminiscent of the 2001 IT bubble burst and the 2008 global financial crisis.
- The semiconductor industry reached its peak in March 2022, but experienced a rapid decline in the latter half of the year.
- Production decreased by 41.8% YoY, a rate comparable to that of July 2001 (-42.3%) and December 2008 (-47.2%).
- The capacity utilization index (SA) declined by 49.1% from its prior peak, a trend akin to that observed in July 2001 (-44.7%) and December 2008 (-48.0%).
- The inventory-to-shipment ratio stood at 254.2, remaining slightly higher than the levels observed in July 2001 (247.6) and December 2008 (204.6).
● The contraction in the semiconductor industry, accounting for 18.9% of total exports (as of 2022), substantially impacted the economic slowdown stemming from dwindling exports.
- Exports remain sluggish, particularly in the semiconductor industry
- In Q1, semiconductor exports recorded a YoY decline of 40.0%, exerting a negative contribution of -7.9%p to the overall drop in exports (-12.6%)
